Sold prices were 3% lower than the previous year and 2% below the 2022 peak of £790,818. The headline figures point to a market that has eased, but they don’t tell the whole story for local sellers.
An asking price can attract attention, especially when a listing says “offers over”, but it is not the same as the price achieved in a completed sale. Property type, location and the details of each home all affect how useful a local comparison is.
This guide explains how Twickenham prices compare with nearby areas and how values have changed over time. It also looks at what current asking prices and past sales can tell you, and why comparing them side by side can help when pricing your own home. One average is not the answer for every property.
Key Takeaways
- Compare local averages by property type and postcode to get a more relevant picture than one town-wide figure.
- Use five- and ten-year trends to put recent price movements into perspective.
- Read sales volumes alongside prices to understand how active the local market has been.
- Distinguish asking prices, “offers over” listings and completed sale prices when judging a home’s likely value.
- Look at nearby sold properties with similar features to build a more grounded starting point for pricing your home.
Average house price and annual price change
That figure gives sellers a starting point, but property type, location and the period covered all affect local comparisons.
Annual price movement
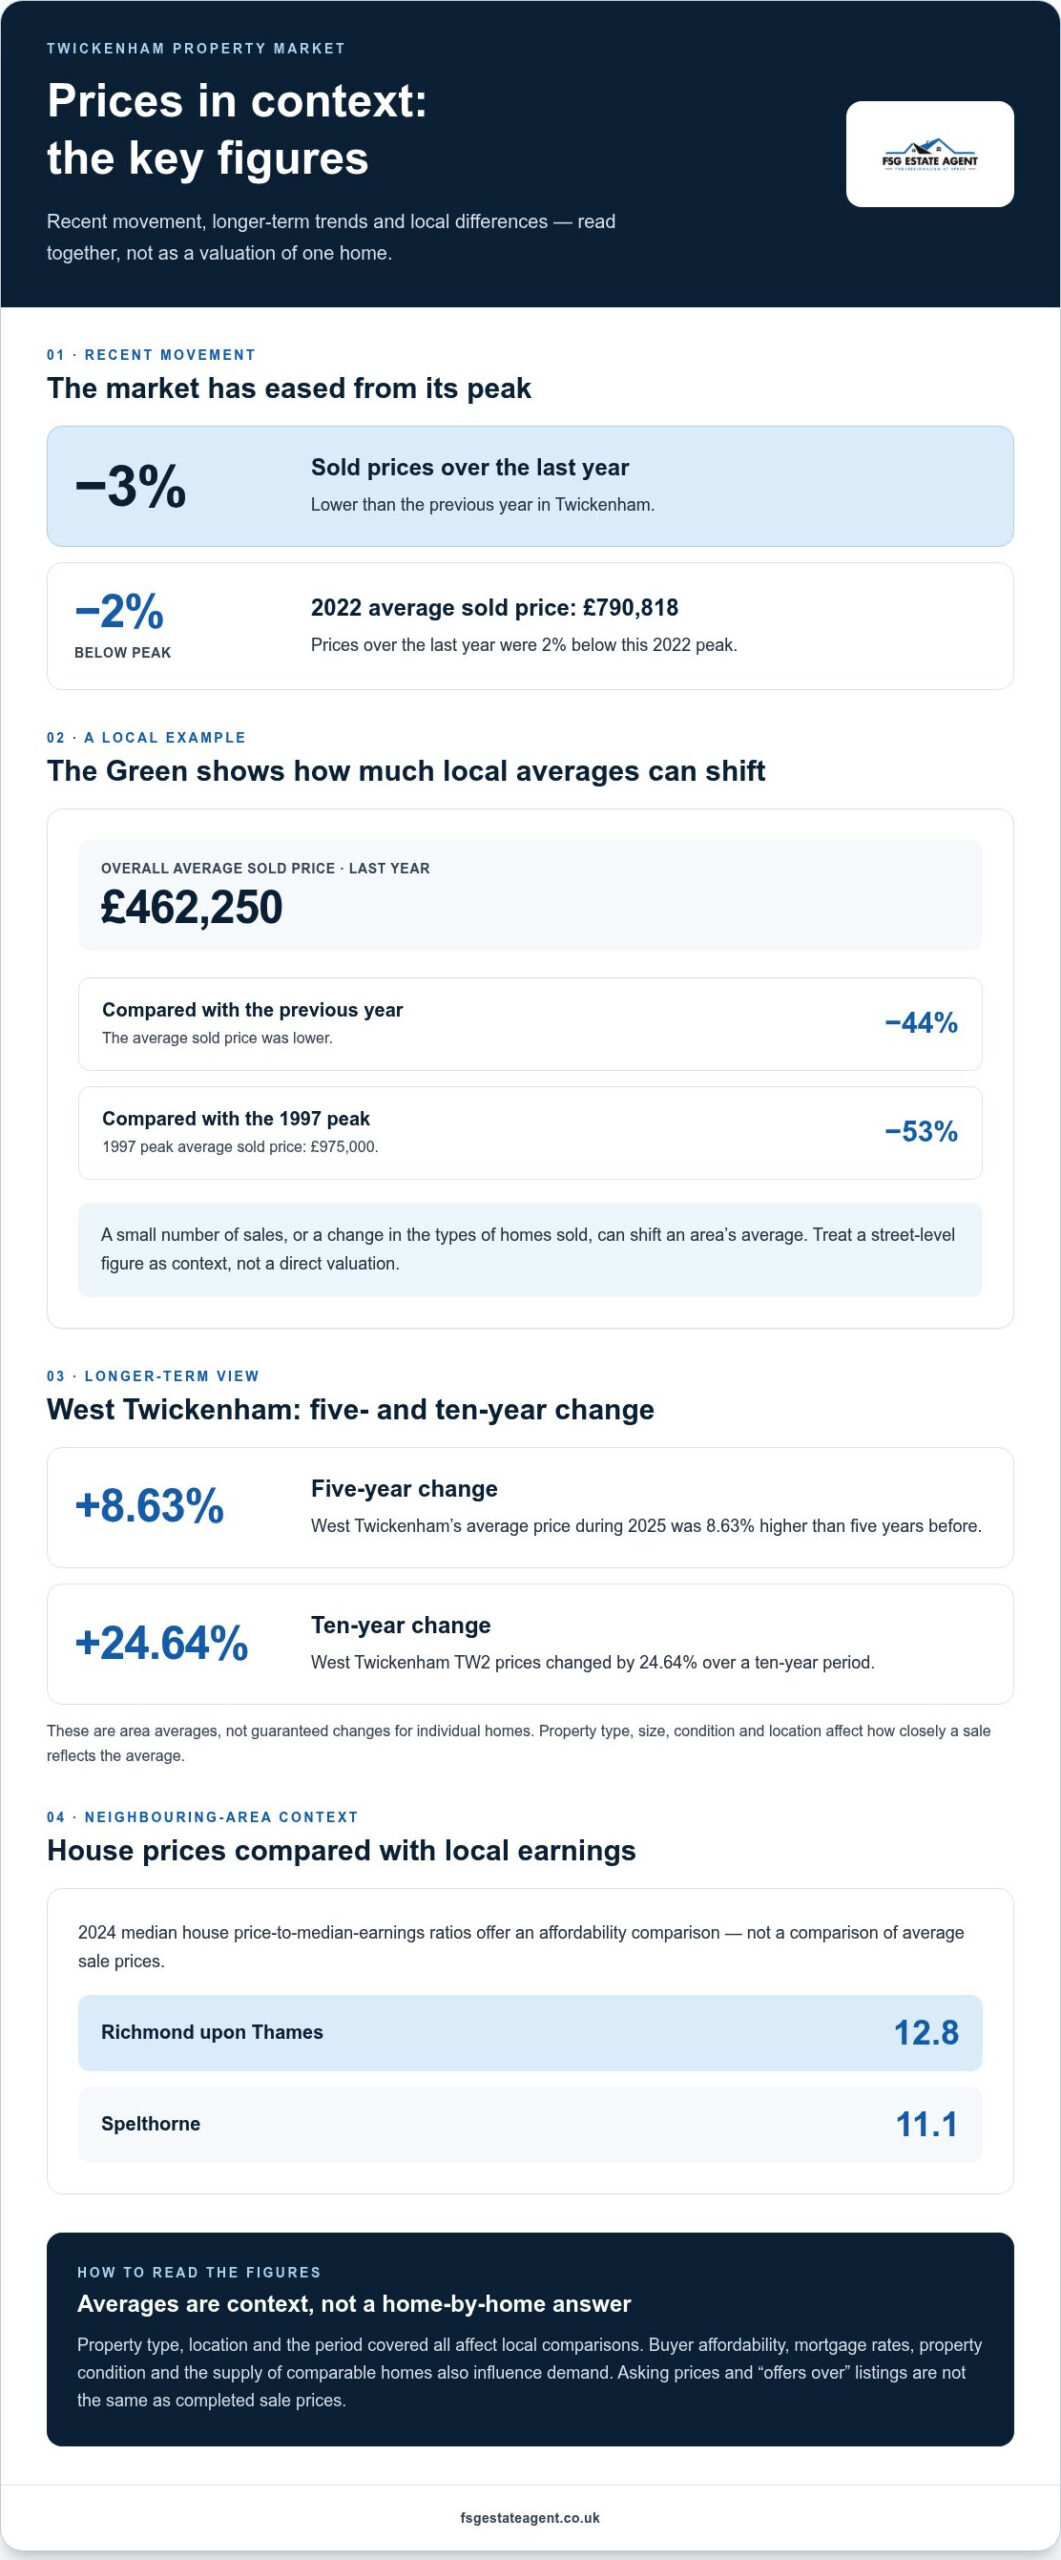
Annual price movement is the change in average sold prices over a year. In Twickenham, sold prices over the last year were 3% lower than the previous year. They were also 2% below the 2022 peak of £790,818. This suggests the market has softened from its peak, rather than showing one uniform value for every home.
The average can be pulled upwards by higher-priced sales, while the median marks the middle transaction. Check the geography and timeframe before comparing figures or setting an asking price.
The Green is a useful example of how local results can differ. Its overall average sold price was £462,250 over the last year. That was 44% lower than the previous year and 53% below its 1997 peak of £975,000. A small number of sales, or a change in the types of homes sold, can shift an area’s average. Treat a street-level figure as context, not a direct valuation of an individual property.
What affects prices now? Buyer affordability, mortgage rates, property condition and the supply of comparable homes all influence demand. Some UK lenders have reduced selected mortgage rates, with a limited number of deals below 5%. Changes in borrowing costs can affect what buyers are able to offer.
Prices by property type
Prices by property type compare typical sold values for different kinds of homes.
These are broad averages, not like-for-like comparisons. Flats can differ substantially in size and condition, while a house’s layout, condition and location affect how relevant the average is. The figures also cover different periods, so do not treat them as a precise ranking of today’s asking prices.
What are typical prices for flats, terraced houses, semi-detached houses and detached houses in Twickenham?
What is the average rent and rental yield for properties in Twickenham? Rent depends on a home’s size, condition, location and tenant demand. Rental yield compares annual rent with the property’s purchase price, so it varies between homes.
For sellers, house prices in Twickenham are most useful when the comparison matches the property. Start with recent sales of similar homes in nearby locations, then consider how their features compare with your own. This is more useful than relying on one headline figure.
Comparison with other postcode areas
A postcode comparison sets Twickenham property values alongside nearby markets and wider England and Wales figures. It can help sellers understand the local position, but differences in property mix and sale periods matter.
Postcode comparison
A postcode average is the mean sold price across homes in that postcode area. These comparisons show Twickenham’s higher price level, not what a specific home will sell for.
That spread shows why a town-wide valuation can miss important local differences. Postcode boundaries group homes of varying sizes, conditions and settings. Compare properties with similar features and nearby sold evidence rather than relying on the postcode average alone.
Comparison with the 2022 peak
A peak comparison measures current prices against an earlier high point. Twickenham’s 2022 average sold price was £790,818. Prices over the last year were 2% below that peak. This indicates that values have not fully returned to their 2022 high, although individual homes can perform differently.
Use the peak as historical context, not as a target asking price. When considering a valuation, compare your property’s current condition and features with recent local sales. A past peak cannot show whether today’s buyers will pay the same amount for a particular home.
Nearby area comparisons
Nearby area comparisons look at adjoining markets to understand local variation. In 2024, Richmond upon Thames had a median house price-to-median-earnings ratio of 12.8. Spelthorne’s ratio was 11.1. These figures compare housing costs with local earnings, rather than measuring average sale prices. They offer context for affordability across neighbouring areas, but not a direct price comparison between individual homes.
Current asking prices provide examples, not completed-sale evidence. Property type and size differ, so these listings are not a like-for-like comparison of Twickenham homes.
Which areas of Twickenham have the highest and lowest house prices? How do prices vary near Twickenham station, schools and the River Thames? Access, property characteristics and buyer demand can affect comparisons, but these figures do not isolate the effect of those features.
For a more grounded comparison, match your home with nearby properties of similar type and condition. Local property market insight can help put postcode figures into context.
Five- and ten-year price trends
Five- and ten-year price trends show how values have changed across longer periods. In West Twickenham, TW2, prices rose over both measured timeframes, but the gains differed.
Five-year trend
A five-year trend compares prices with their level five years earlier. West Twickenham’s average price during 2025 was 8.63% higher than five years before. This gives sellers a longer view than a single year’s movement. It also shows why a current asking price shouldn’t be based only on the latest market shift.
That 8.63% figure covers West Twickenham TW2, not every Twickenham home. It describes an average across properties, rather than a guaranteed rise for each property type. A detached home, flat and terraced house can follow different paths. Their condition, size and location all affect how closely an individual sale reflects the area’s average.
Ten-year trend
A ten-year trend compares average values with those from a decade earlier. West Twickenham TW2 prices changed by 24.64% over a ten-year period. The comparison indicates longer-term growth across the area, while the five-year figure captures a shorter part of that wider pattern.
Read this alongside the 24.64% change, not as a value that applies to every home. The average includes sales of different property types and conditions. A shift in which homes sold can also affect the overall figure.
Richmond upon Thames provides a wider local backdrop, but the TW2 trend is more specific to West Twickenham. Neither figure can show exactly what a particular home would achieve today. For a useful comparison, sellers can start with the property’s type, then consider its condition and location. They can also compare it with similar local homes sold during a matching period.
Long-term growth provides context, not a pricing formula. If your home is a flat, do not treat the area-wide average as a direct comparable for a detached house. The same applies when comparing a renovated property with one needing work. Match the homes first, then use wider five- and ten-year trends to understand the backdrop.
When reviewing a valuation, separate the property’s own features from general market movement. Note whether each comparison concerns West Twickenham TW2 or a broader area. Keep the timeframe consistent, too. Those steps make the 8.63% five-year change and 24.64% ten-year change easier to interpret without mistaking area averages for individual sale predictions.
Historical transaction records
Historical transaction records list completed property sales, including dates, prices and property types. Twickenham transaction data covers 1 January 1995 to 28 August 2026. That long span helps sellers compare past transactions, but a sale from years ago is not a direct guide to today’s value. Start with recent records, then use older examples to understand longer-term change.
Sales volume shows how many properties changed hands during a defined period. In the Twickenham postcode area, 4,700 properties sold from September 2025 to August 2026. Sales dropped by 21.6% over that reported period. Fewer completed transactions mean fewer recent examples for comparison. Sellers should consider whether nearby sales match their home’s type and location before treating them as useful evidence.
West Twickenham TW2 recorded 119 property sales in the 12 months to April 2026. That total was 12.50% lower than the comparable previous period. The monthly picture moved differently: sales in April 2026 were 200.00% higher than in April 2025, yet 62.50% lower than in March 2026. These figures show how a single month can differ from the wider annual pattern.
Property type matters when reading West Twickenham’s records. The latest 12 months included 61 terraced sales, 30 semi-detached sales and 27 flat sales. There was one detached sale. The small detached count means its recorded average reflects very limited transaction evidence. For a detached home, sellers should focus on the details of the closest relevant sales, rather than relying on a broad category average.
The Green’s records show how much transactions can vary within one street. Different prices illustrate why bedroom count alone cannot establish a fair comparison. Tenure, condition, layout and exact position can all distinguish one flat from another.
Older sales add context, but property details still matter. The dates, bedroom numbers and sale values differ, so treat these as separate records rather than like-for-like evidence.
For a practical comparison, record each sale’s date, address, property type, bedroom count and tenure. Compare the closest recent matches first. In Richmond and across England, historical records help explain market movement, but matching property characteristics makes each example more useful to sellers.
Asking prices and offers over
An asking price is the figure a seller advertises for a property. “Offers over” means the seller is inviting offers above that amount; it does not report a completed sale. This distinction matters in Twickenham: listings show current expectations, while sold records show agreed transaction prices.
Current examples across nearby TW postcodes cover different property types and price points.
Other Whitton listings start lower. These examples show how asking prices vary by property type, bedroom count and location. They are asking figures, not evidence of what a buyer will ultimately pay.
“Offers over” does not guarantee a minimum sale price. The final agreed amount depends on the offer the seller accepts. Compare the wording and property details, then look for completed sales of similar homes.
How long do homes take to sell in Twickenham, and how do asking prices compare with sale prices? Time to sell varies with asking price, property condition, buyer demand and progression after an offer. Asking prices are advertised expectations; sale prices are the agreed amounts recorded after a transaction completes.
For a clearer comparison, note each listing’s postcode, property type, bedroom count and price wording. Then compare those details with completed sales, keeping the time period and location as close as possible. A five-bedroom semi-detached home in Whitton is not a direct match for a two-bedroom bungalow, even if both sit within TW2.
London-area asking prices need context too: a listing can remain visible without showing whether its price has changed or an offer has been accepted. Treat it as a snapshot, then assess it alongside sold evidence and your home’s features. This gives sellers a more grounded basis for deciding how to position a property.
To shape an asking price around your home’s features and local evidence, request a free property valuation.
FSG Estate Agent: Property Sales Agency Service
FSG Estate Agent provides a Property Sales Agency Service for homeowners preparing to sell. Turn to the team for a clear view of your home’s market position and support throughout the sale. Local Property Experts provide a Personal Service from valuation to completion. Professional property marketing presents your home to potential buyers, while Proactive Sales Progression helps keep the transaction moving after an offer is accepted.
Past sales, nearby asking prices and property details provide useful context, but turning that evidence into a selling plan takes careful judgement. FSG Estate Agent can help you assess the market and prepare for the next steps. If you are considering a sale in Twickenham, Richmond or Chiswick, contact FSG Estate Agent to discuss your plans.
Turn local insight into your next move
House prices in Twickenham provide useful context, but your next decision should centre on your own plans. Consider your preferred timing, what needs preparing and the kind of buyer your property may suit. A clear plan helps you move from market research to practical decisions without relying on one headline figure.
FSG Estate Agent offers a Property Sales Agency Service supported by Local Property Experts and a Personal Service. If you are weighing up whether to sell or how to prepare, discuss your priorities and the steps involved. The focus is on helping you make an informed choice at a pace that works for you.
Contact FSG Estate Agent today to discuss your plans. A straightforward conversation can help you decide what to do next, with your home and circumstances at the centre.
Frequently Asked Questions
How is the market performing in Twickenham?
Twickenham’s market has softened on several recent measures, while activity has also eased. The average property price in the postcode area fell by 1% over the twelve months to August 2026, and sales dropped by 21.6% over the reported period. For a seller, this makes accurate comparisons especially useful: assess homes with similar features and locations, then consider how much choice buyers have locally.
What is the average house price in Twickenham in 2026?
These figures cover different areas and periods, so they are not interchangeable. When comparing your home with market averages, use the figure that best matches its location and the period covered by the sales.
How have house prices in Twickenham changed over the past year and five years?
Over the last year, sold prices in Twickenham were 3% lower than the previous year. In West Twickenham TW2, the average price during 2025 was 8.63% higher than five years earlier. These measures cover different locations and periods. To assess a particular home, compare it with similar properties sold nearby, rather than assuming the area-wide movement applies equally to every type of property.
How do Twickenham house prices compare with Richmond upon Thames, Greater London and the UK average?
Richmond upon Thames had a median house price-to-median-earnings ratio of 12.8 in 2024, a measure of affordability rather than sale prices. Compare like-for-like areas and measures when judging Twickenham against London or national figures.
How long do homes take to sell in Twickenham, and how do asking prices compare with sale prices?
The material gives no selling-time figures. Asking prices are not completed-sale prices, so compare listings with recent sales of similar homes and features for a more grounded view.